
StarRocks2.0.0-GA尝鲜测试
--2022-01-13 刘春雷
1、汇总
【]测试结论】:
-
1.19.5与2.0.0-GA在SSB性能测试上差别不明显。此处也咨询官方:
- ssb要等2.1版本才会有性能提升
-
版本升级后要注意:低基数优化相关的问题
-
升级到2.0.0-GA后,SQL执行时间变长了一些,幅度不大
后续深度的测试,敬请期待…
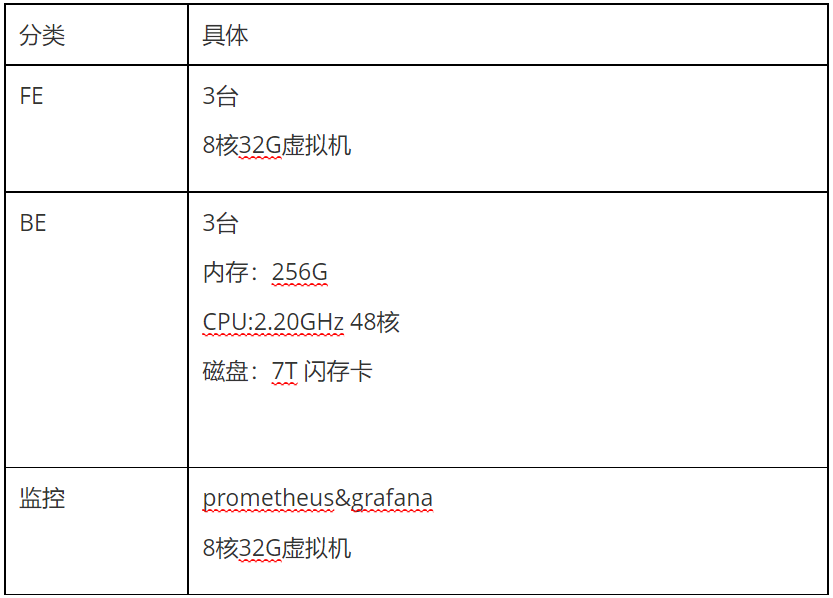
2、测试基本信息
测试程序机器:10.0.0.1
测试集群:xxx-1
测试计划:
对比 1.19.5 与 2.0.0-GA 版本的SSB性能
【安装】:
cd /opt/soft/
wget https://starrocks-public.oss-cn-zhangjiakou.aliyuncs.com/ssb-poc-0.9.3.zip unzip ssb-poc-0.9.3.zip
cd ssb-poc
make && make install
【生成100G数据脚本 】:
cd /opt/soft/ssb-poc-0.9.3/ssb-poc/output
sh bin/gen-ssb.sh 100 data_dir
【修改配置】:
vim /opt/soft/ssb-poc-0.9.3/ssb-poc/output/conf/starrocks.conf
【如果没有pymysql需要安装下】:
/opt/soft/python3.6/bin/python3.6 -m pip install PyMySQL
【导入数据】:
cd /opt/soft/ssb-poc-0.9.3/ssb-poc/output
sh bin/stream_load.sh data_dir
【 插入数据到宽表lineorder_flat 】:
sh bin/flat_insert.sh
sql: ssb_flat_insert start
sql: ssb_flat_insert success
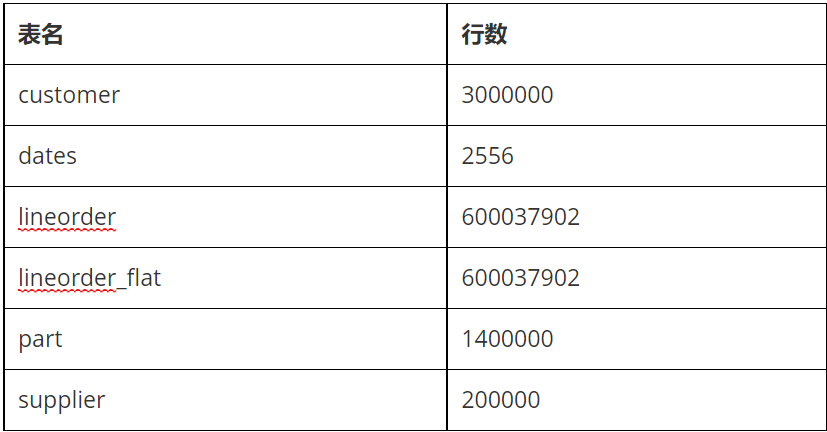
【表条数】:
4、测试结果
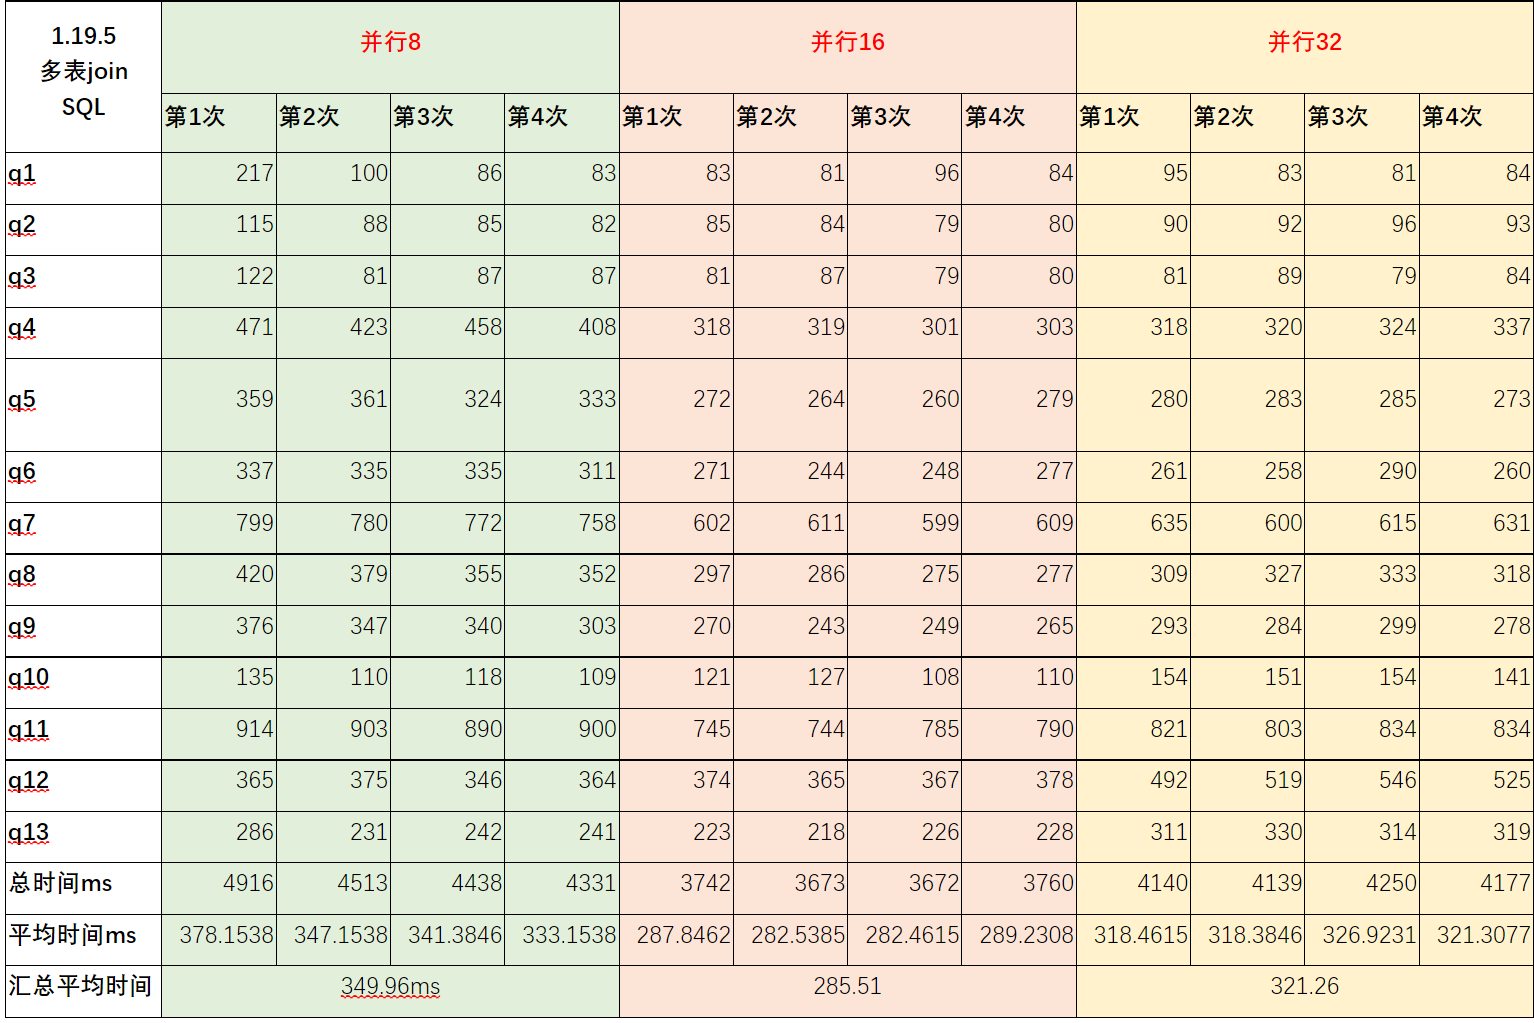
4.1、多表测试
配置文件里面调整并行度:
vim /opt/soft/ssb-poc-0.9.3/ssb-poc/output/conf/starrocks.conf
此次测试 8,16,32并行度
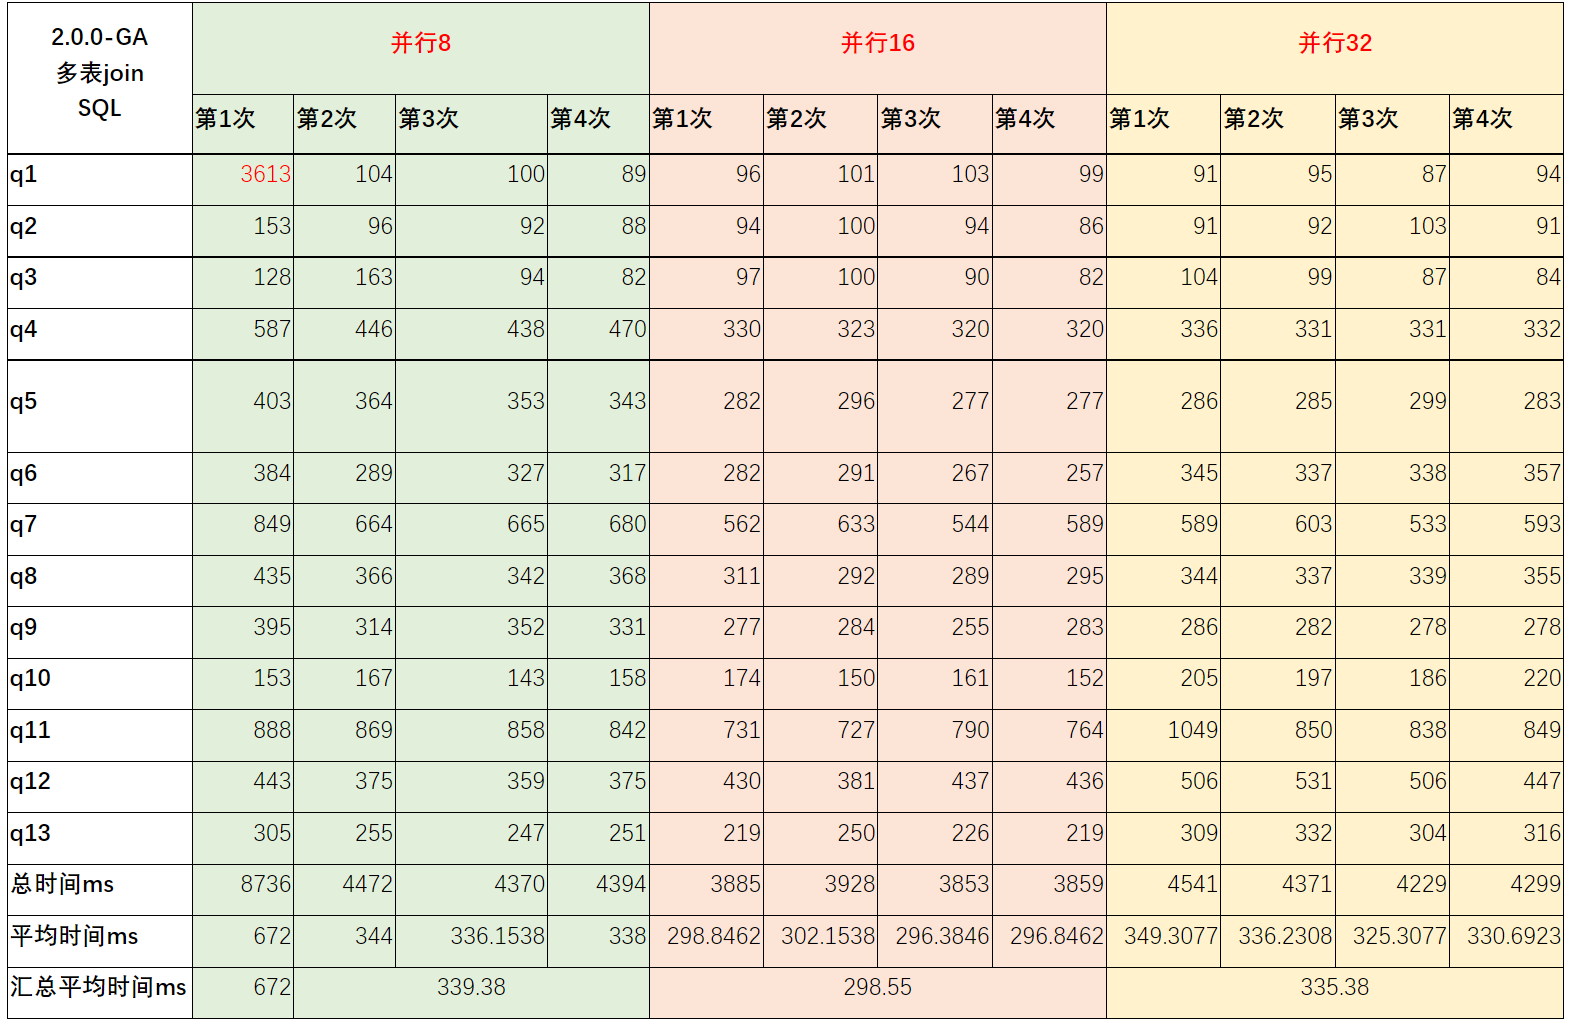
【多表SSB测试:执行测试结果详细】:
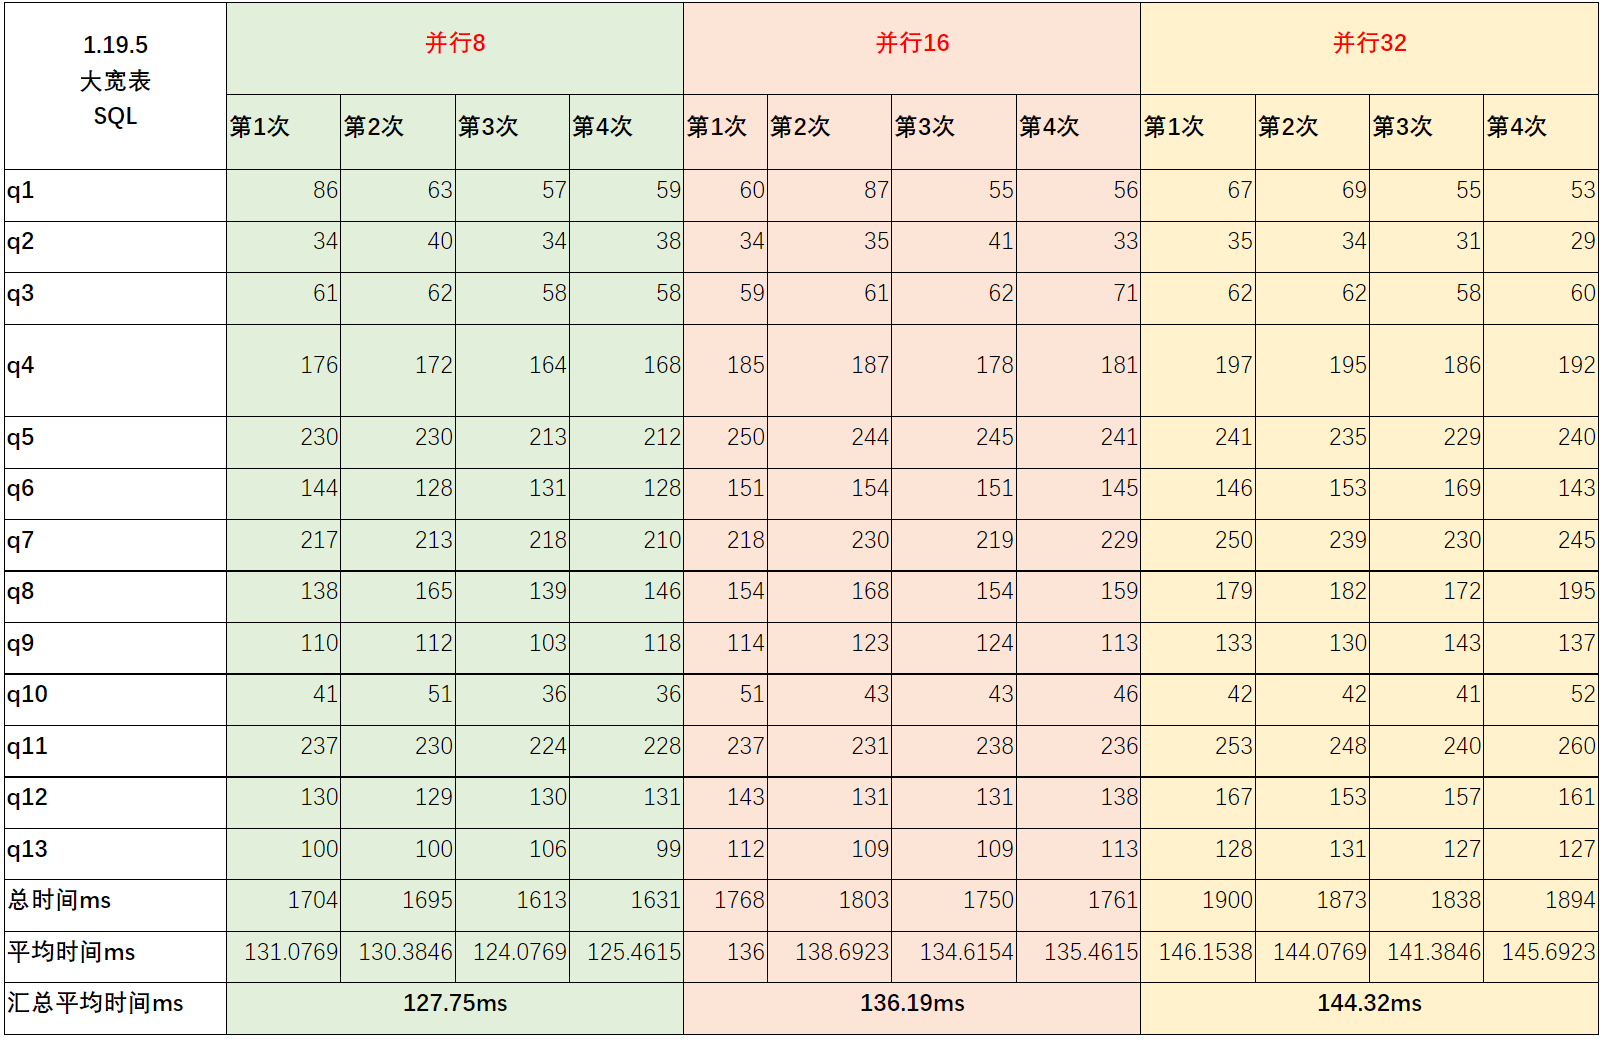
4.2、大宽表测试
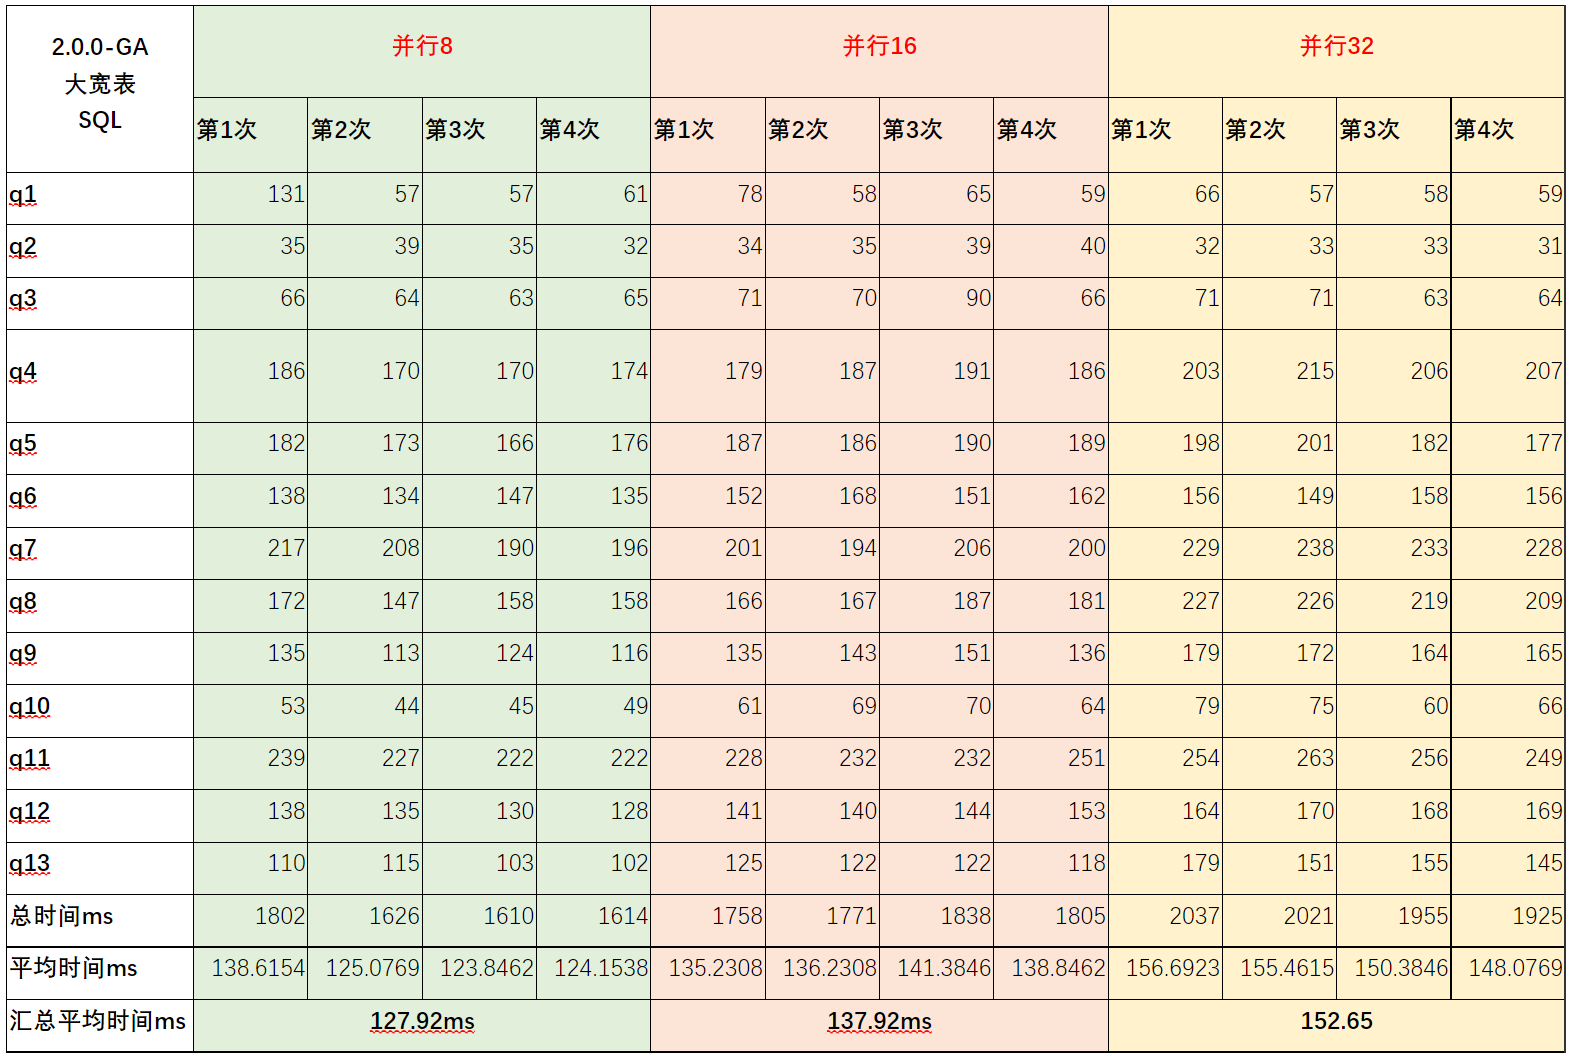
【 大宽表SSB测试:执行测试结果详细 】
5、升级版本到2.0.0-GA
starrocks_manage cluster upgrade $集群号 1.19.5 2.0.0-GA
mysql: [Warning] Using a password on the command line interface can be insecure.
Welcome to the MySQL monitor. Commands end with ; or \g.
Your MySQL connection id is 93
Server version: 5.1.0 StarRocks version 2.0.0-GA
注:此处的starrocks_manage 为自研的管理工具
6、新版本测试
6.1、多表测试
注:第一次执行3613ms 为升级重启后的第一次查询,跟缓存有观察。可以忽略
6.2、大宽表测试
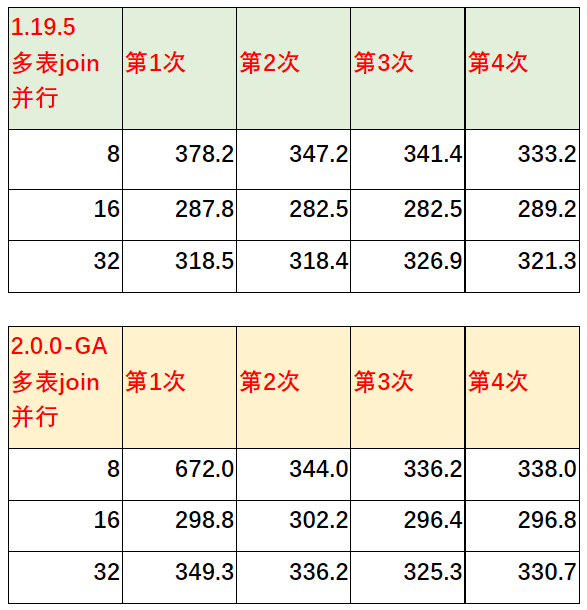
7、对比汇总说明
【多表join】:
【大宽表】:
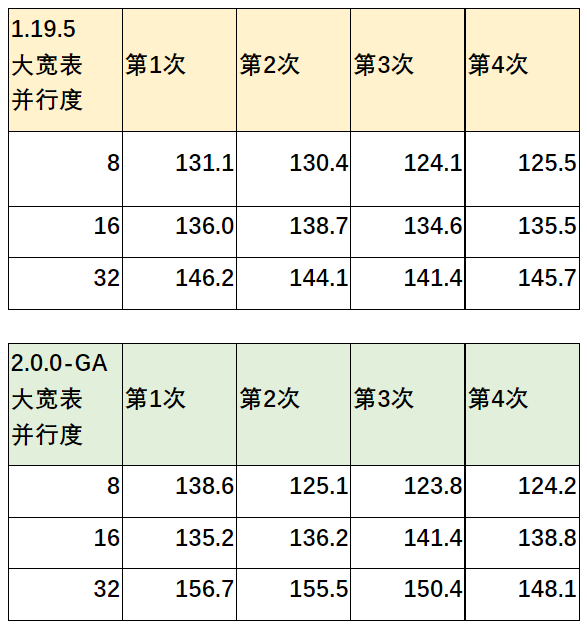
【说明】:
- 1.19.5与2.0.0-GA在SSB性能测试上差别不明显。此处也咨询官方:
- ssb要等2.1版本才会有性能提升
8、线上表现
8.1、线上问题
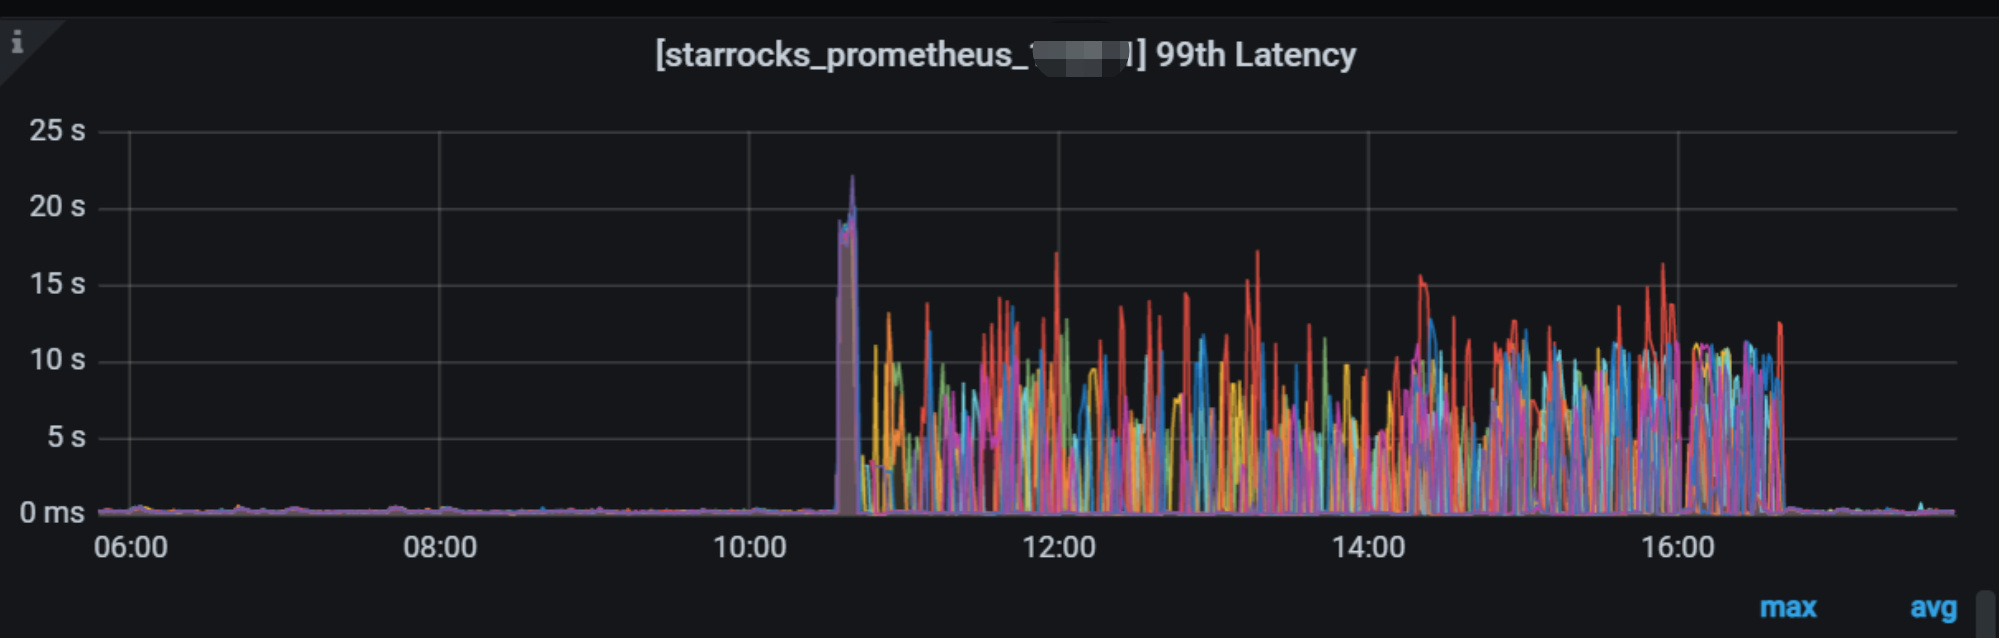
升级业务: 某安全实时分析的业务
升级后,业务使用报错:
1064, ‘cid:3 column has a non-dictionary coding page’
原因:1.19 之前小的导入没有变成字典编码,升级到2.0之后,有三个副本,假如只有一个副本做了新的compaction,那么这个时候会有全局字典,但是其他两个副本没有局部字典,这个时候低基数优化应用到其他两个副本的时候就会遇到这个问题,先关闭掉,过段时间等其他副本compaction完成了,补齐编码就可以打开低基数优化了
处理:set global cbo_enable_low_cardinality_optimize=false;
调整完参数后,99th Latency 降低了,业务也没有在报错了
官方: 低基数优化官方还在做些优化,2.0可以先别开,等下个版本2.0.1
8.2、线上情况
8.2.1、Query Error
【情况】 :query_error变少了
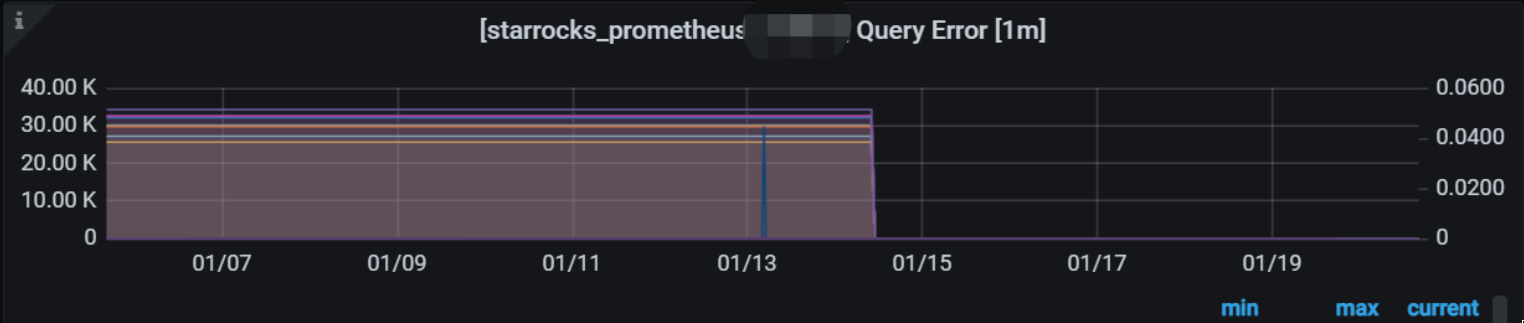
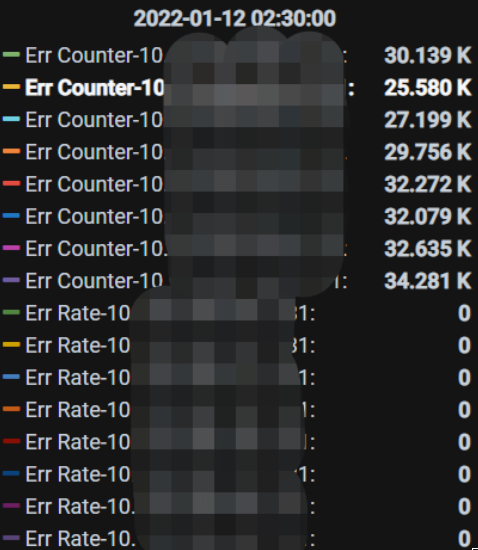
【监控图说明】 :此图为监控的错误query数,可能语法错误、超时、执行失败等这类的count
【情况说明】:
- starrocks_fe_query_err 为累增值,重启归零了,属于正常
【错误SQL排查】:
日志:/opt/soft/starrocksxxx/fe/log/fe.audit.log
关键字:State=ERR
此值比较高的原因是 :之前BE机器的内存比较小,业务量比较大,BE经常oom导致SQL执行失败
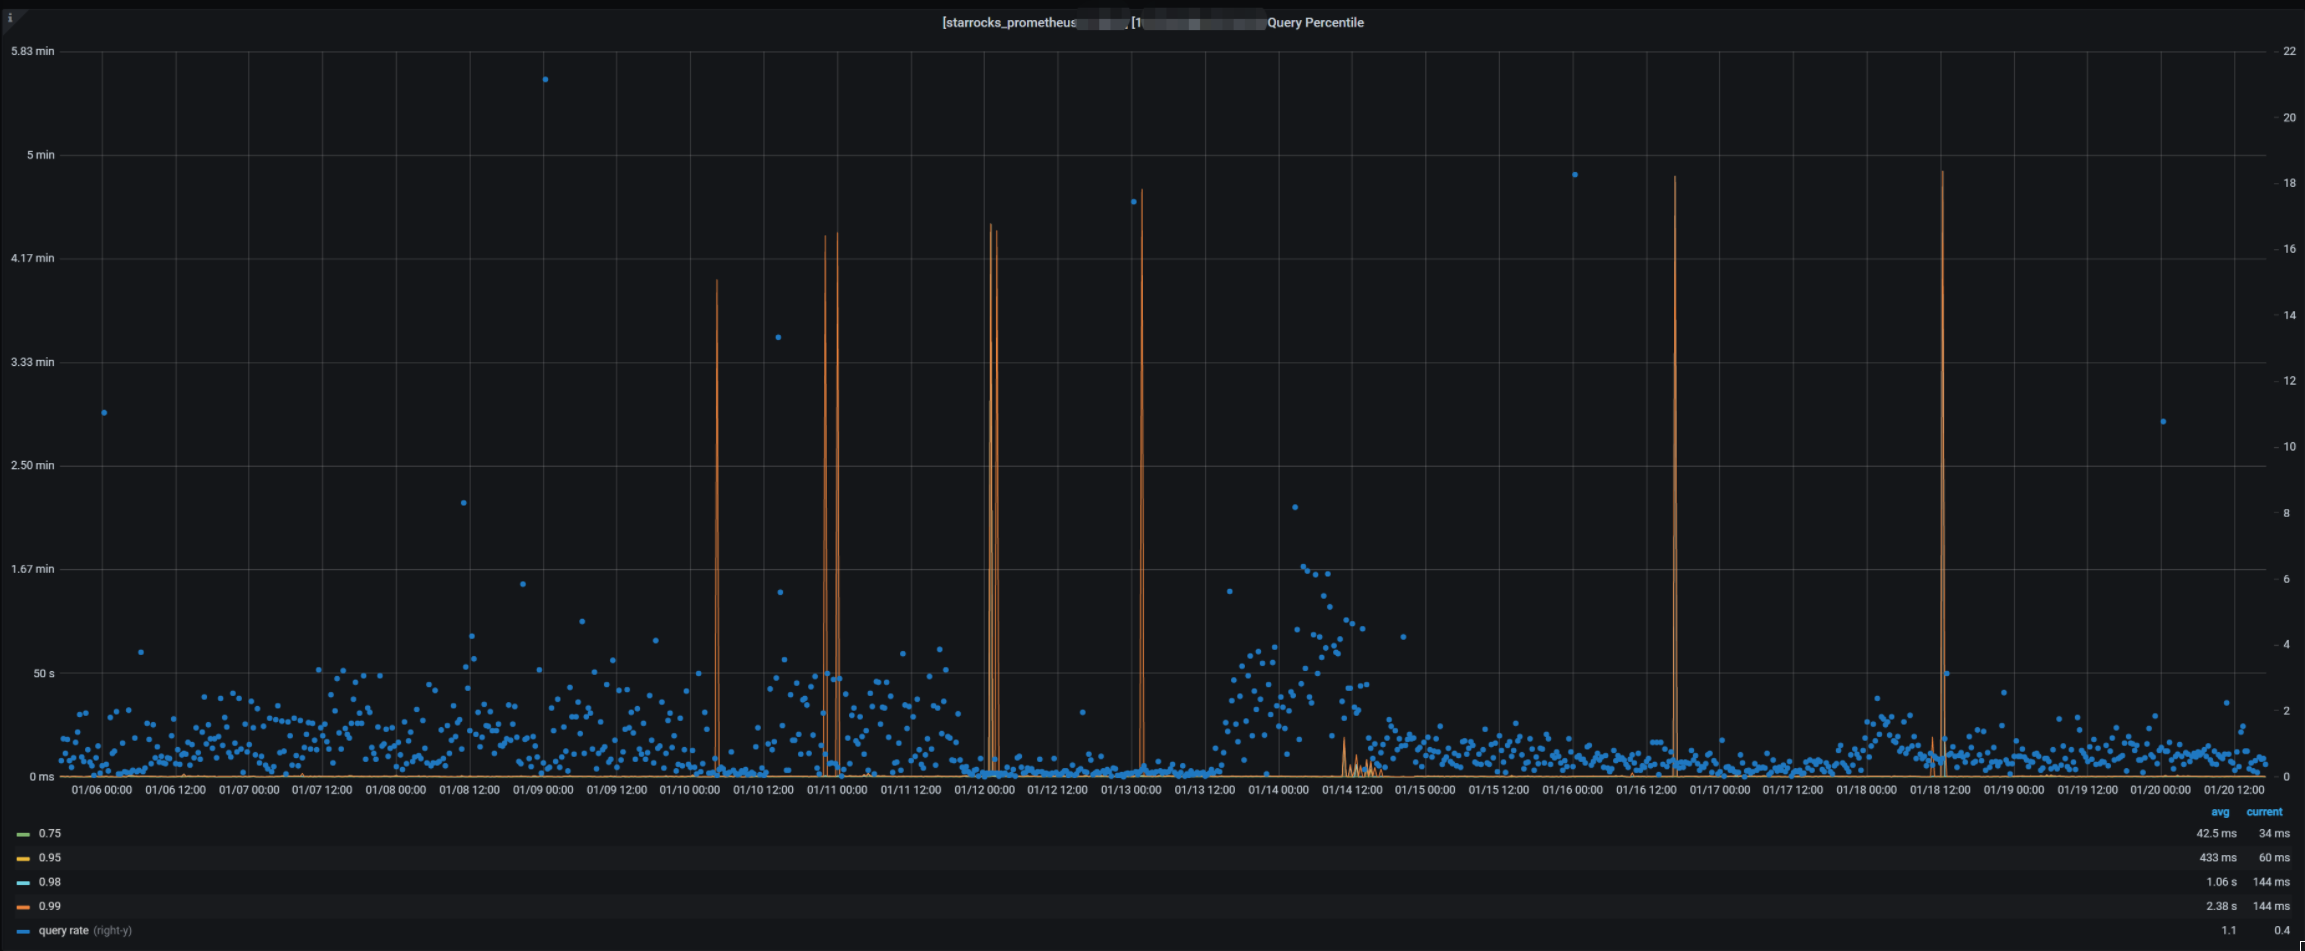
8.2.2、Query Percentile
升级时间为1.13号10:30 - 10:50 之间
1.14号10点调整了低基数优化的参数
8.2.3、SQL执行时间
cd /opt/soft/starrocksxxx/fe/log
for i in {01…13};do echo fe.audit.log.202201$i;cat fe.audit.log.202201$i-1|awk -F ‘Time=’ ‘{print $2}’|awk -F ‘|’ ‘{print $1}’|awk ‘{sum+=$1} END {print "ALL Sum="sum,“ALL Count=”,NR,"Average = ", sum/NR}’;done
for i in {14…19};do echo fe.audit.log.202201$i;cat fe.audit.log.202201$i-1|awk -F ‘Time=’ ‘{print $2}’|awk -F ‘|’ ‘{print $1}’|awk ‘{sum+=$1} END {print "ALL Sum="sum,“ALL Count=”,NR,"Average = ", sum/NR}’;done
升级前:
fe.audit.log.20220101 ALL Sum=18494035 ALL Count= 555187 Average = 33.3114
fe.audit.log.20220102 ALL Sum=14759602 ALL Count= 502176 Average = 29.3913
fe.audit.log.20220103 ALL Sum=14557738 ALL Count= 528659 Average = 27.5371
fe.audit.log.20220104 ALL Sum=17765004 ALL Count= 568105 Average = 31.2706
fe.audit.log.20220105 ALL Sum=18458837 ALL Count= 539361 Average = 34.2235
fe.audit.log.20220106 ALL Sum=18309854 ALL Count= 565988 Average = 32.3503
fe.audit.log.20220107 ALL Sum=25887696 ALL Count= 614138 Average = 42.1529
fe.audit.log.20220108 ALL Sum=15987472 ALL Count= 569888 Average = 28.0537
fe.audit.log.20220109 ALL Sum=16470396 ALL Count= 606457 Average = 27.1584
fe.audit.log.20220110 ALL Sum=12816001 ALL Count= 391184 Average = 32.7621
fe.audit.log.20220111 ALL Sum=23006252 ALL Count= 549020 Average = 41.9042
fe.audit.log.20220112 ALL Sum=23633764 ALL Count= 415237 Average = 56.9163
fe.audit.log.20220113 ALL Sum=28528802 ALL Count= 591153 Average = 48.2596
升级后:
fe.audit.log.20220114 ALL Sum=19071100 ALL Count= 308390 Average = 61.8409
fe.audit.log.20220115 ALL Sum=26284963 ALL Count= 485205 Average = 54.1729
fe.audit.log.20220116 ALL Sum=24384963 ALL Count= 455719 Average = 53.5088
fe.audit.log.20220117 ALL Sum=18621800 ALL Count= 416695 Average = 44.6893
fe.audit.log.20220118 ALL Sum=20846850 ALL Count= 483148 Average = 43.148
fe.audit.log.20220119 ALL Sum=20063703 ALL Count= 450343 Average = 44.552
【图】
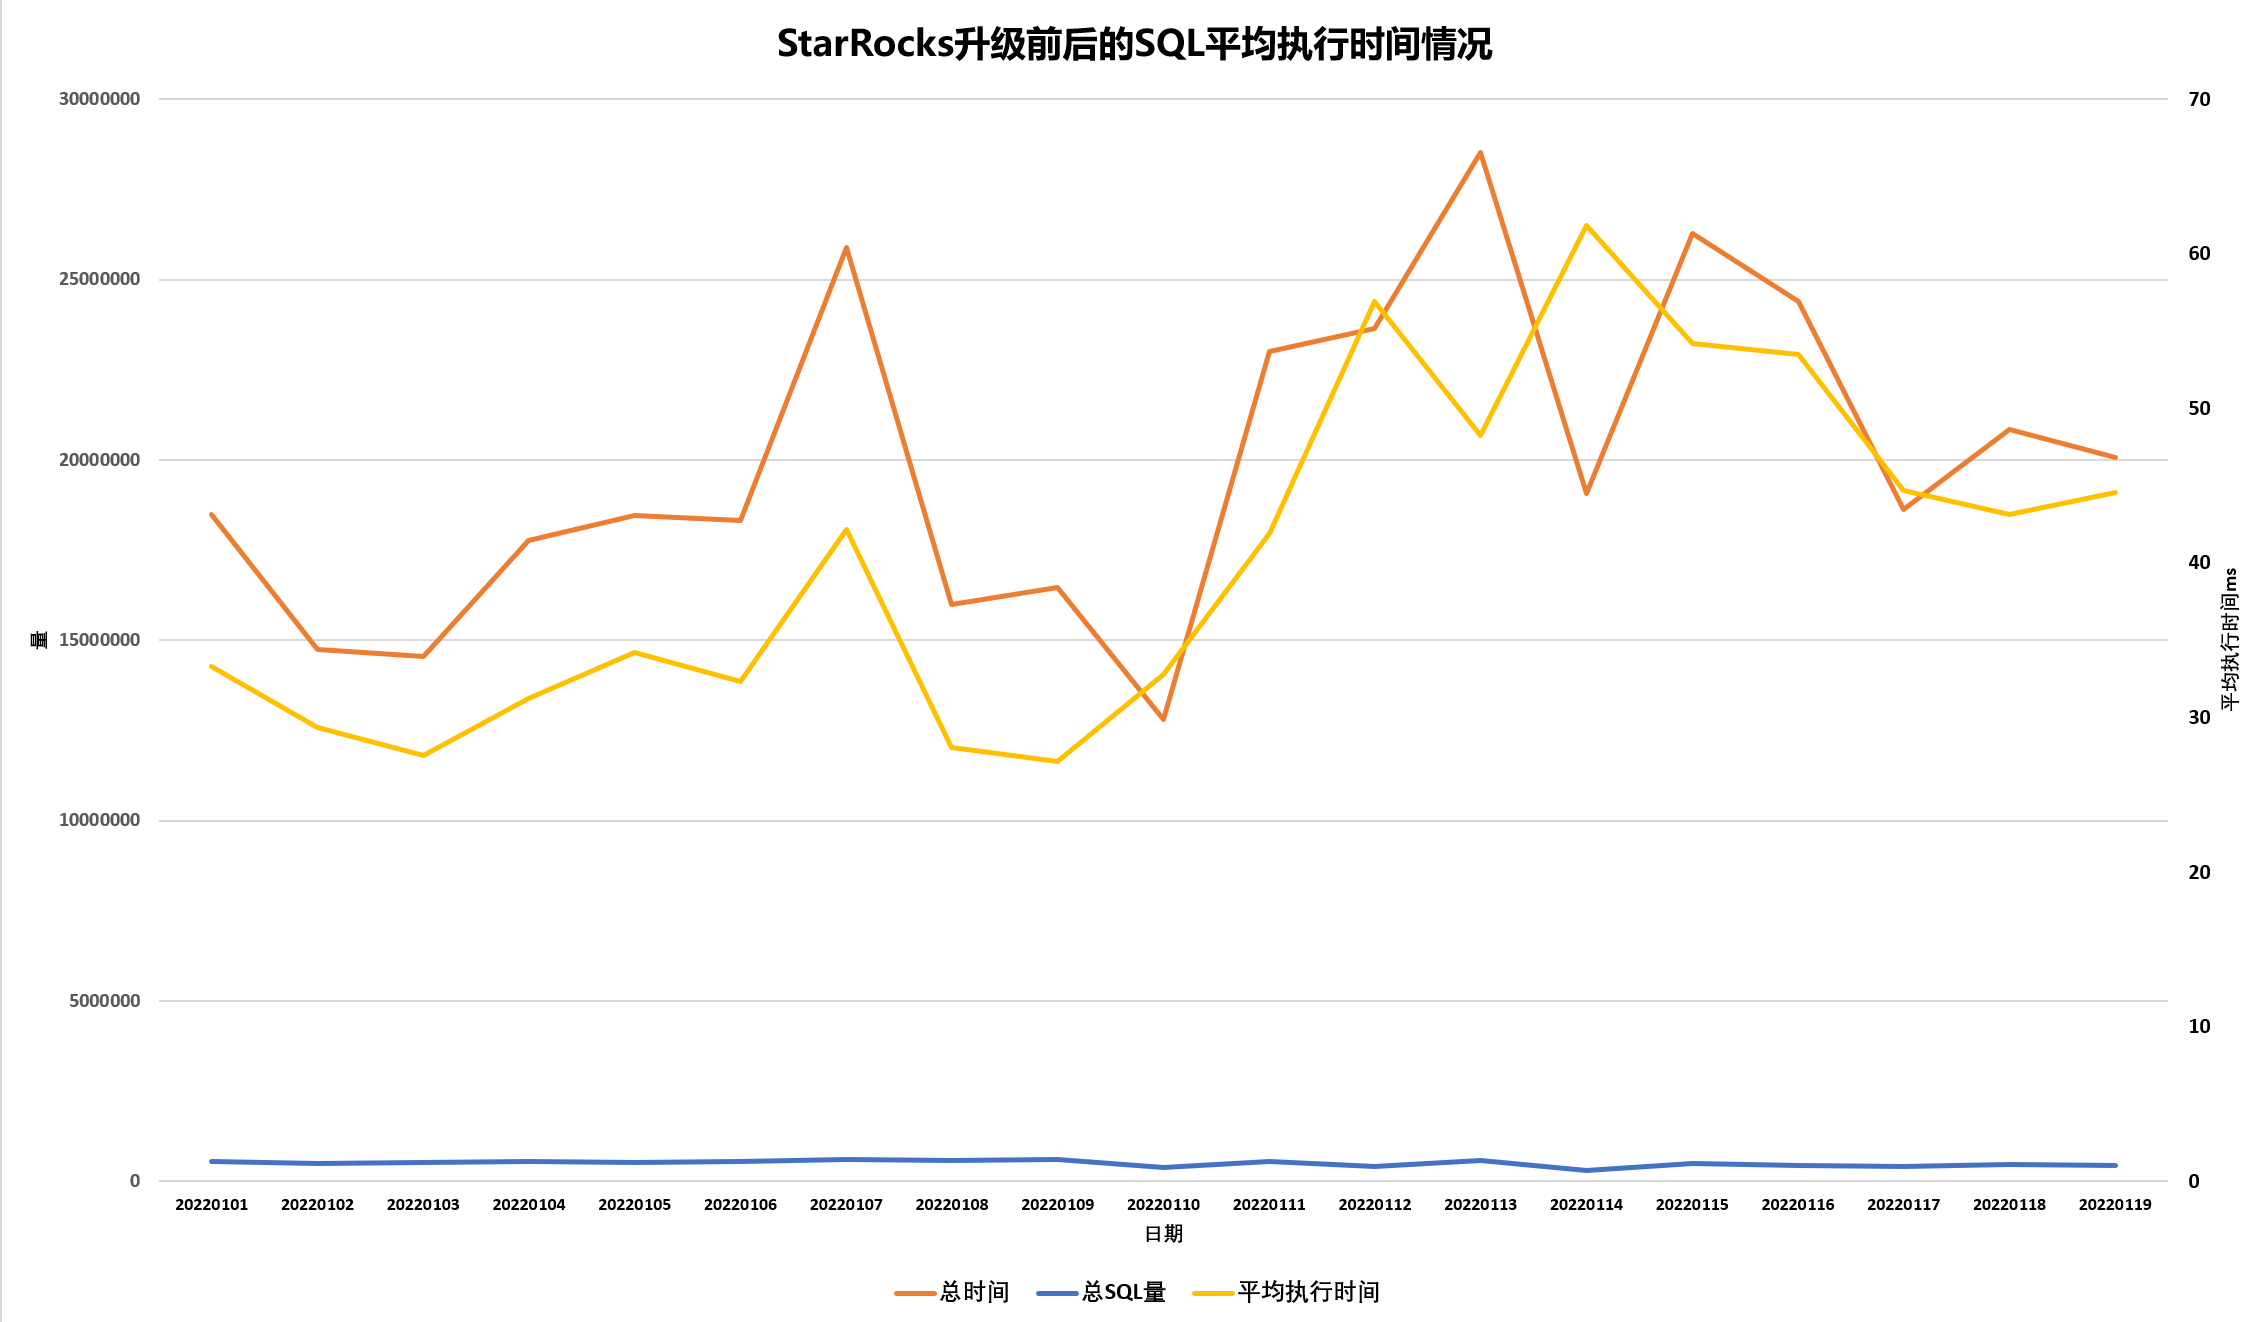
【说明】:升级后SQL平均执行时间稍微增量了一些
8.3、其他
线上的性能表现、新特性表现,因节前工作比较多,适当推迟了,敬请期待…